
/f/131443/716x454/1ca638056c/full-year-tsm-benchmarking-2025-26-feature.png)
/f/131443/927x596/3db997d70d/essentials-customer-satisfaction-measurement-guide-feature.png)
/f/131443/761x484/8a1fd07041/index-cs-q2-2026-feature.png)
/f/131443/1962x1135/e8f74f1bf6/customer-research-review.png)
What is your NPS margin of error?
7 November 2022
Net Promoter Score (NPS) is a wildly popular measure, but it is rarely subject to the kind of statistical scrutiny that it should be.
There's no generally-agreed consensus on the right way to calculate margins of error (or confidence intervals) for NPS, and the result is that it is very rare for people to quote or even calculate margins of error for NPS.
This is a problem, because one thing we know for sure is that NPS has much wider margins of error than other headline measures. In this post we'll explain why margins of error matter, discuss some methods for calculating NPS margins of error, and share some data on how the different methods perform.
Why Margins of Error Matter
All survey statistics come with a margin of error or confidence interval (we'll use those terms interchangeably), which captures the fact that no sample can give a perfect measurement of the population it represents.
If you don't know what your margin of error is, then you have no way of knowing whether or not you should trust the results of your survey. You don't know whether this month's score is really higher or lower than last month's, you don't know whether the differences between customer groups are real, and you don't know how your score really compares to whatever benchmarks or targets you're interested in.
Without margins of error, a survey score is little better than guessing.
If we've done our sampling and questionnaire design well then we will have minimised the chance that systematic error or bias might distort our survey findings (non response bias, leading questions, and convenience samples are all examples of things which might create a systematic bias), but even so all samples are affected by random measurement error.
To make good decisions, we need to know how wide those margins of error are.
Calculating NPS Margins of Error
There are standard and agreed methods for calculating confidence intervals for most survey statistics, whether mean scores or percentages, but there is not yet a consensus on the best way to calculate NPS margins of error. Below we review and test four of the most popular methods.
[To make things a bit simpler, we're using z-values instead of t-values in each case, so these formulas are only applicable with samples of at least 30. And if that all sounds like gobledigook, don't worry about it for now!]
Confidence Interval for a Mean Score
This is probably the easiest method for most people, although it's harder to see the theoretical justification for it.
One way to think about, and calculate, NPS is to recode your data so that Detractors are given a value of -1, Passives a 0, and Promoters 1. This means that you can now work out your NPS as a simple mean average of your data, which makes it much easier to analyse results for subgroups (for instance by using Pivot Tables in Excel).
It also means that you can calculate a confidence interval in the same way that you would for a mean score, based on the standard deviation (SD) and sample size (n). The formula for the 95% confidence interval is:
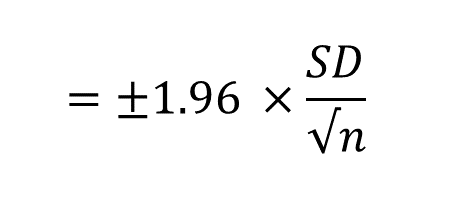
And you can work it out in Excel using =CONFIDENCE(0.05,SD,n). Easy!
Bootstrap Confidence Intervals
A more robust method for calculating confidence intervals, and one that can be used to work out margins of error for many statistics for which there is no classical way of calculating them, is "bootstrapping".
This technique works by creating thousands of new samples from your sample, with replacement, to replicate how statistics would vary in different surveys we might have run with customers. By taking the range covered by the middle 95% of our bootstrap samples we can create a 95% confidence interval range for any statistic, including NPS.
That sounds a little like magic, like you're conjuring imaginary samples from nowhere, which is why the name nods towards the idea of "pulling yourself up by your bootstraps." It can be a tricky thing to wrap your head round, but this approach to statistics has proven remarkably effective.
There's no formula this time, but you will need some way of running a bootstrap analysis.
Wald Interval
The Wald interval is a common way to calculate confidence intervals for a proportion or percentage, but because NPS is built on two percentages rather than a single percentage, we need to calculate it a little differently.
To work it out you'll need to know how many promoters and detractors you have, as well as your total sample size. The formula now becomes:
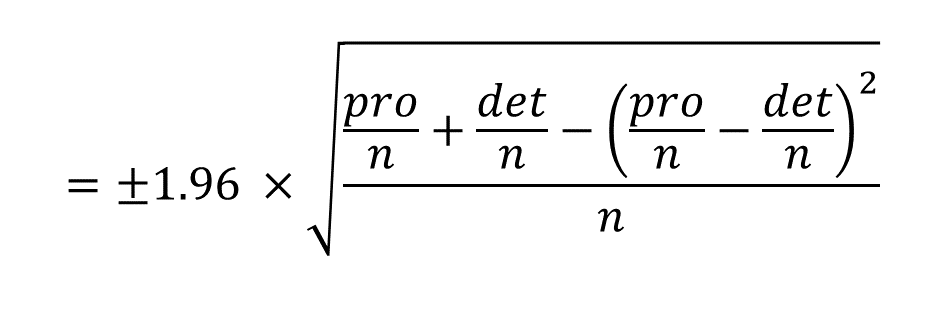
The Wald interval is easy to calculate, but has been shown not to do a good job when sample sizes are small and proportions are extreme.
Adjusted Wald Interval
The adjusted Wald interval was developed to offset the weaknesses of the Wald interval at small sample sizes, and it works by adding a small weight to smooth out some of the bumps. In an article for the American Statistician, Brendan Rocks showed that the most effective weights were to add 3/4 to the counts for Promoters and Detractors, and 3/2 to the count for Passives (which works out as 3 to add to the total count).
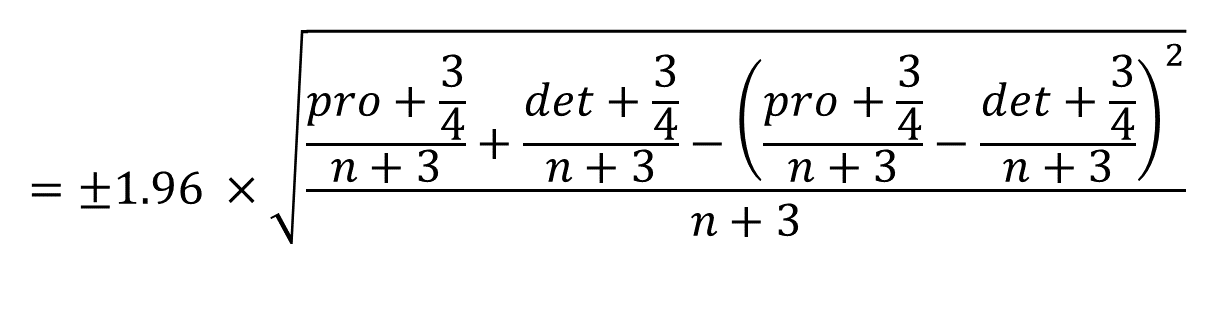
That might look a bit arbitrary, but it is based on a solid combination of theory and pragmatic testing of which weights work best.
Comparisons
What makes for a good confidence interval? You might think that it would be one that always included the population mean, but actually that's not the case. There's a trade-off between the precision of our estimates (i.e. how wide the margins of error are) and the coverage (i.e. how often the margins include the true population mean). It looks like this:
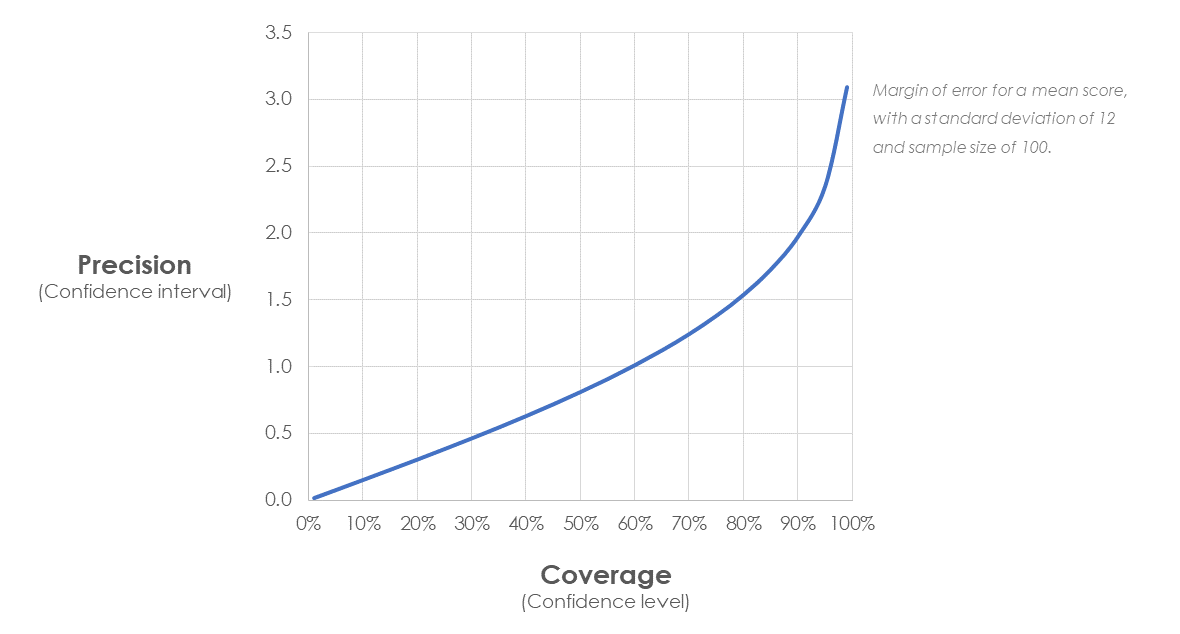
What that means is that we're looking for confidence intervals which, on average, include the population mean as often as we expect based on the confidence level we've chosen, which is usually 95%. In other words, we actually want to find that the population mean is outside our quoted margin of error 5% of the time, otherwise our confidence intervals are too conservative.
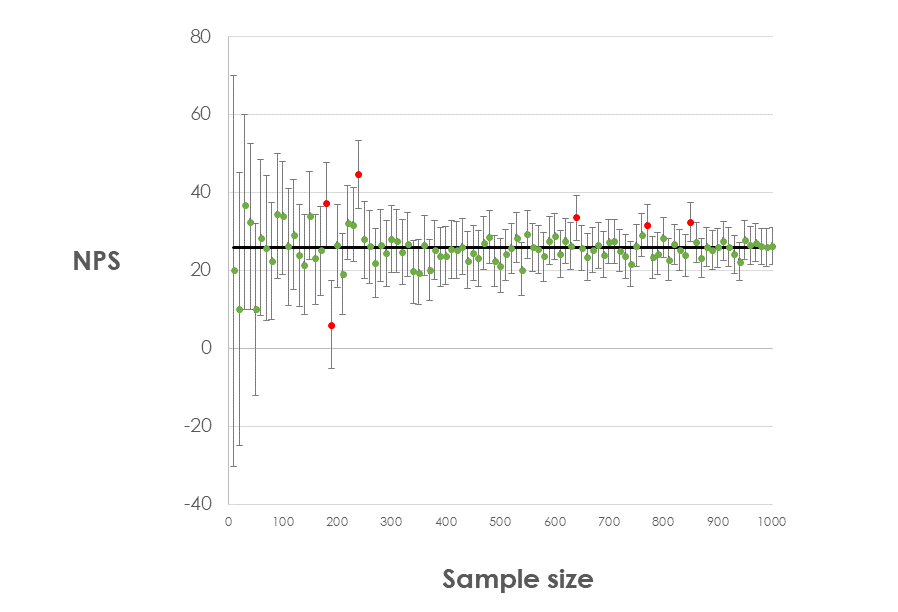
To understand how these four different methods perform, we took a pool of over 13,000 NPS results from a survey of UK consumers, and treated this as our "population". We drew random samples of different sizes from this population, and worked out the margins of error using each of the four methods.
This means that we know what the true population figure really is (25.9 in this case), so we can see how far away sample estimates were and how often the margins of error do or don't cover the population mean.
First of all, let's look at what the margins of error are at different sample sizes:
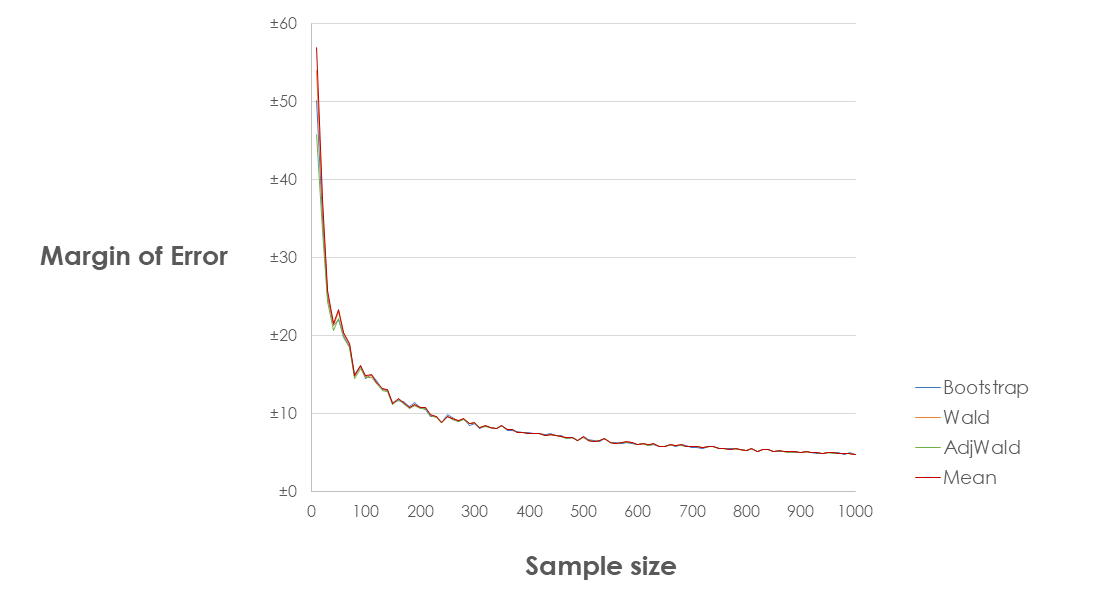
As you can see the results from the different methods are very, very similar once you get to reasonable sample sizes. So similar, in fact, that I didn't believe it until I checked them quite a few times! Charting the range across the four different methods makes it obvious how quickly they converge:
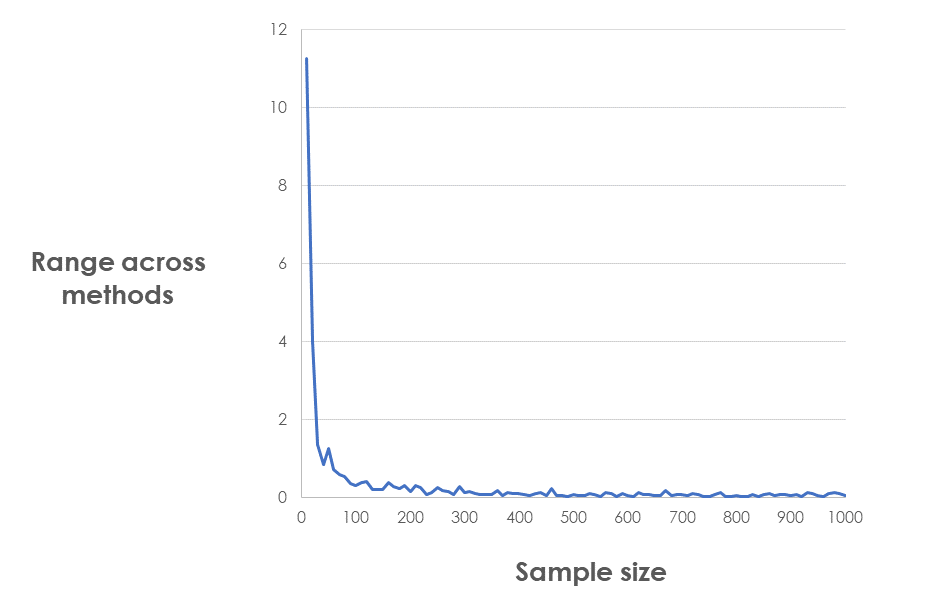
We can draw our first conclusion: for samples over 100, it makes little difference which method you use to calculate margins of error.
Let's zoom in on that bottom end. Where are the differences?
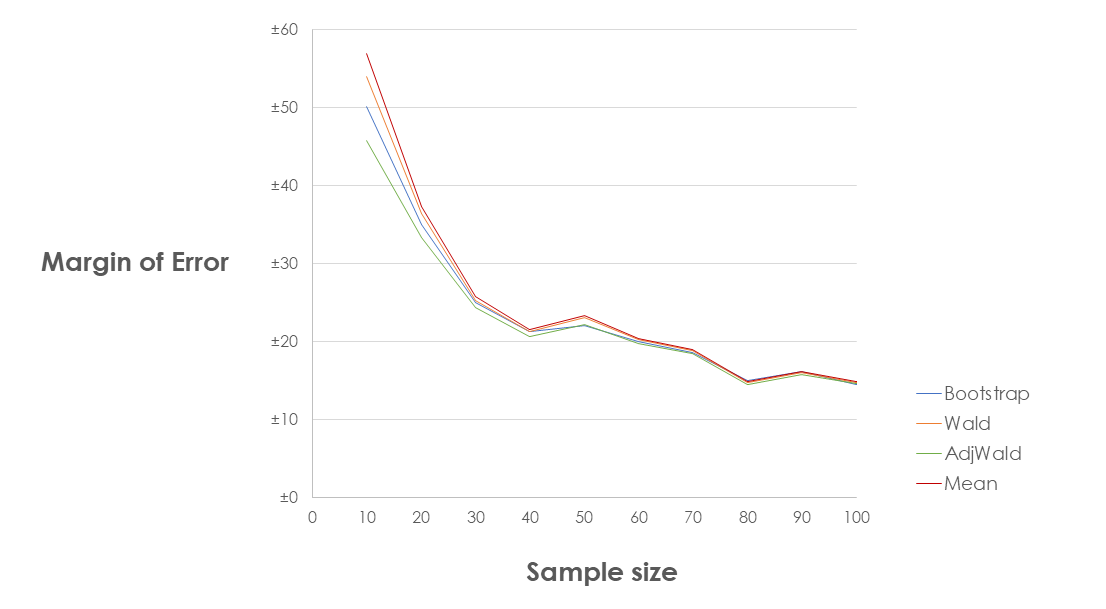
As expected, it's at low sample sizes that the Adjusted Wald interval comes into its own, which supports the conclusion of Rock's paper: with small samples, the most precise NPS confidence intervals come from the Adjusted Wald Interval (3,T).
What about coverage? Well in this small test every method did equally well: all of them were wrong 6 times out of 100, as the chart below shows. It also very effectively demonstrates that larger sample sizes give more precise margins of error, but we're still expecting to be wrong 5% of the time, by design.
We'd need to run many more tests, using thousands of samples at each sample size, to definitively test the coverage of each method, but this suggets that all methods have good performance at reasonable sample sizes and for average NPS scores.
Conclusions
This is not an academic paper, and there are some things we'd need to test to draw totally robust conclusions. We would need to replicate this analysis with more samples at each sample size, and with a range of NPS distributions, both high and low.
Nonetheless, we can say that these results suggest that for most organisations any of these four methods of calculating margins of error will produce good results, and is certainly better than nothing. At reasonable sample sizes they seem to produce margins of error that are astonishingly similar.
If you need to calculate margins of error with very small samples (say less than 30), then the Adjusted Wald Interval may be the best choice, but be aware that your margins of error will still be very large.
Get in touch
Get in touch if you have any questions, or if you'd like some help with your own margins of error.
Related Insight
Webinar
/f/131443/500x500/db7c90648a/understanding-statistical-significance-webinar-thumbnail.jpg)
Understand Statistical Significance And Confidence Intervals
Statistical significance can seem like a complicated and arcane world, but it’s vital to understand the basics if you want to make decisions with data. We’ll cover what you can and can’t do with survey data, why confidence intervals may make more sense than significance testing, ...
Podcast
/f/131443/1060x1059/ee0d5845f6/tlf-podcast-thumbnail-6.png)
How NPS is Used
Can you believe Net Promoter Score is 18 years old? Love it or hate it, you can’t deny that NPS has been the most successful movement in the history of customer research. NPS has become a de facto standard, but like its inventor Fred Reichheld, we have reservations about the wa...
Webinar
/f/131443/500x500/a8a1c32b1d/the-flaws-of-nps-how-to-get-the-most-webinar-thumbnail.jpg)
The Flaws of NPS and How to Get the Most Out of it
The Net Promoter Score approach to customer research has strengths, but it also has many weaknesses. Some experts argue that NPS is useless because of these, but it's as big a mistake to dismiss NPS altogether as it is to embrace it unthinkingly. In this webinar we'll look at th...
News & Opinion
/f/131443/500x500/1b4f39c856/what-is-nps-thumbnail.jpg)
What is a Net Promoter Score (NPS)?
There's no doubt that word of mouth (positive and negative) is a big part of the reason that customer satisfaction links to business performance, and Net Promoter Score (NPS) taps into that mechanism. Here we look at a definition of NPS and how we can help your organisation measu...